There is so much power packed into this little FireFox plug-in. It is truly a revolutionary tool for web developers. Here is a quick and dirty set of its most powerful features.
Note: Firebug is no longer active, but all the tips in this post can still be used in Chrome, Safari, FireFox, or Edge developer tools.
Open up developer tools using the [CMD+OPTION+I] keyboard shortcut.
To get started, open up firebug using F12 or by clicking its icon  in the lower right corner of FireFox. To jump straight to the console and start typing commands you can use the Ctrl+Shift+L keyboard shortcut.
![]()
From here you can type commands. Try entering document. This will bring up the document DOM object and you can click on that link to get to the DOM and inspect all of the properties of the document object. A shortcut is also available by typing inspect(document) etc. You can use $ and $$ as in Prototype, such as $(‘firebug’) and inspect($$(‘.firebug’)). Use the up and down arrows to cycle through command history.
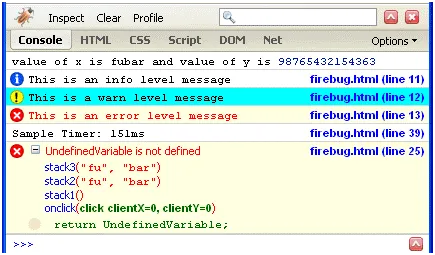
- Use console.log and sprintf formatting commands for debugging.
- Use console.info, console.warn and console.error to set your debugging levels.
- Use console.time to log the time your functions take to run.
- Use the error console to view the stack trace of the errors.
You can download Firebug Lite to make these methods work in Internet Explorer. I recommend that you remove your console commands before you go live.
Try test using console.log You can use sprintf formatting here
function consoleIntro() {
  const x = "fubar";
  const y = 543;
  console.log("value of x is %s and value of y is %d", x, y);
}
Try console.info|warn|error
function consoleLogLevels() {
  const a = "This is an info level message";
  const b = "This is a warn level message";
  const c = "This is an error level message";
  console.info(a);
  console.warn(b);
  console.error(c);
}
Try console.time|timeEnd
function timeThisTask() {
  console.time("Sample Timer");
  for (let x = 0; x < 10; x++) {
    console.log("test", x);
  }
  console.timeEnd("Sample Timer");
}
Try to see stack trace of the errors
function stack3(d, e) {
  return UndefinedVariable;
}

function stack2(d, e) {
  return stack3(d, e);
}

function stack1() {
  const d = "fu";
  const e = "bar";
  const f = stack2(d, e);
  console.log(f);
}
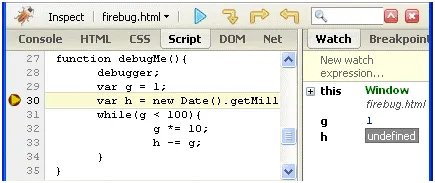
Use the debugger to add breakpoints, debug JavaScript code and step through your code.
There are 3 ways to trigger the debugger:
- Use the debugger command.
- Add a breakpoint by clicking on the line number
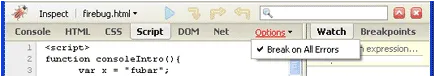
- Enable the “Break on All Errors” option for the Script tab.
Try a using the debugger command
function debugMe() {
  debugger;
  let g = 1;
  let h = new Date().getMilliseconds();
  while (g < 100) {
    g *= 10;
    h -= g;
  }
}
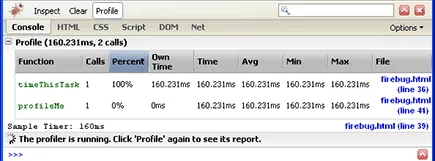
Use the profiler to record detailed statistics on your Script calls and DOM events. This works very much like macros. To manually start profiling click on the profile button in the Console tab. Then try performing some actions on the page. When you are done click on the profile button again. A report is returned which captures the funtions that were called within that time period.
The report output data can be sorted. Own Time tells you how much time each function call took in milliseconds and as a percentage of the total time which can be useful in finding bottlenecks in your code.
You can also add profilers to your code via the console.profile("foo") - console.profileEnd("foo") function calls. This can be great when you want to track down events that happen onload.
Try the using console.profile|profileEnd command
function profiledFunction() {
  console.profile("Test Auto Profiler");
  timeThisTask();
  console.profileEnd("Test Auto Profiler");
}
You can log calls to a specific function call and see what parameters are being passed to it and how many times it is being called. To do this open the script tab, find your function and right click within it. From the popup menu choose the “log calls to “function name"".
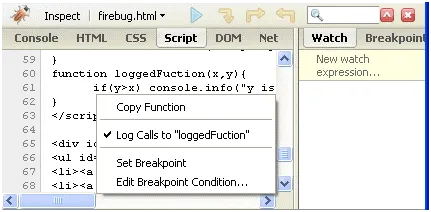
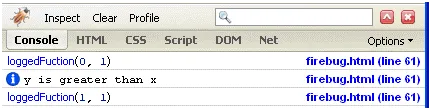
Now whenever that function is called you get a nice message in the console along with the parameter values sent to it.
Try the test with logged functions
function loggedFuction(x, y) {
  if (y > x) console.info("y is greater than x");
}

function callLoggedFunction() {
  for (let x = 0; x < 2; x++) {
    for (let y = 1; y > 0; y--) {
      loggedFuction(x, y);
    }
  }
}
In the HTML tab you can also log events for specific elements. This can be useful when you are creating elements on the fly via the DOM and want to track all the events happening behind the scenes.
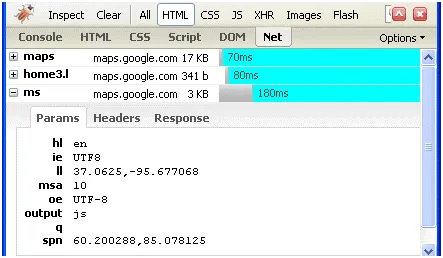
The Net tab is quite useful for tracing HTTP request and responses. Network traffic can be filtered by type (HTML, CSS, JS, Images, XmlHttpRequest). The Params tab is very handy and shows you the request parameters in a table format. This is great for tracing your Ajax requests. The issue with this that I found is that once a request is made which leaves the current page you loose the previous pages net events. Maybe a feature for the next version of FireBug?
From the HTML tab you can use the Layout tab to view and edit any element’s offset, margin, border, padding and dimension values on the fly.
In the Style sub tab of the HTML tab you can choose an option to “Show Computed Style” which shows you the final style values of the selected HTML element. Another neat trick is that you can click on any CSS property and edit it inline in real time. You can use the up/down keys and page up/page down keys to change numeric values and see your changes in real time, for example padding etc.